Traverse Global v11.2 - Service Repair
Dashboard Functionality
Once you enable the dashboard, the dashboards tab, or screen, is ready to have dashboards added to it.
Within each dashboard you are able to customize the information that is brought into the dashboards, how the information is displayed (in a grid or in a graph) and the position of the dashboard within the screen.
To add dashboards to your screen, follow these steps:
- Hover over the Options button to display the Dashboard Options window.
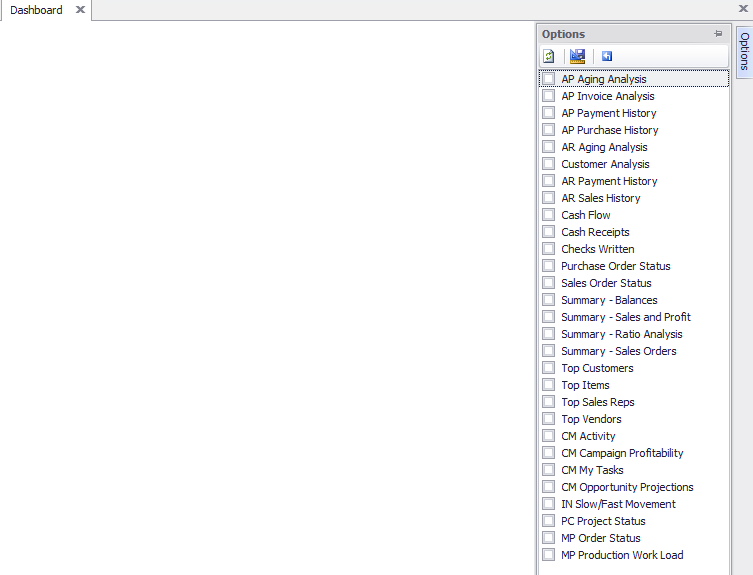
The Options window becomes hidden if you click out of the Options window. You can also use the Pin button (
 ) to keep the Options window viewable while working with the dashboards. Unpin the Options window to hide the Options window.
 - Use the Options window to select the dashboard components you want to display by marking the check box next to the dashboard name.
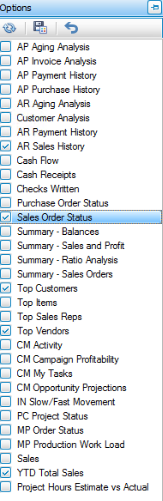
- After selecting the dashboard components you want to display, click the Refresh button (
 ) to refresh the data to display for the selected dashboards.
 - Use the Refresh button to refresh the entire Dashboard to display the selected dashboard components with the most up-to-date data available.
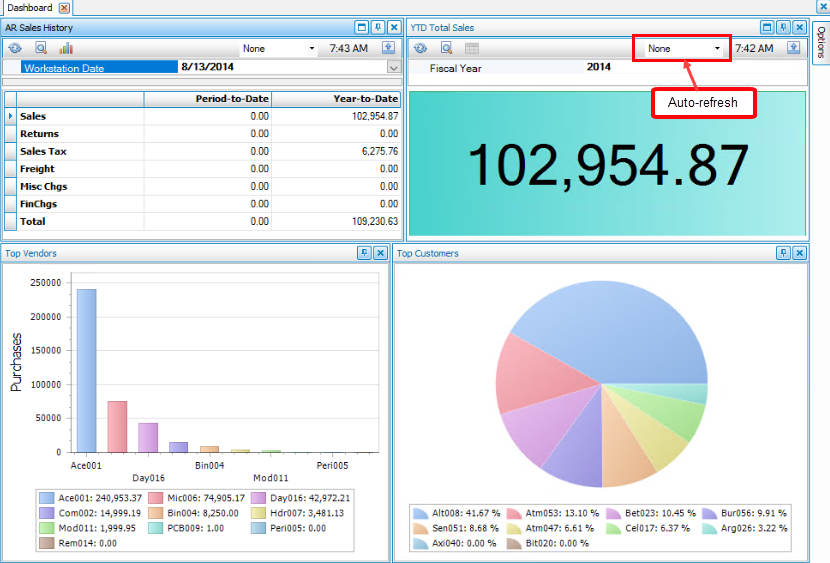
 Auto-refresh
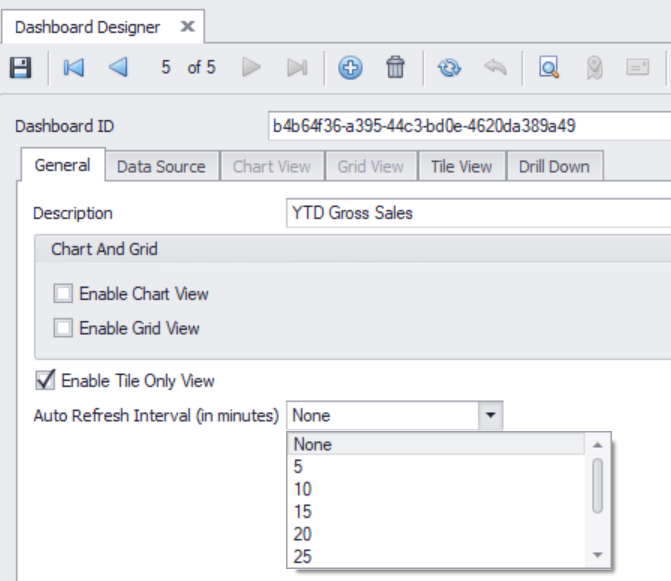
Use the Auto-refresh option to automatically query the data at a selected interval. The intervals can be set individually for every dashboard.
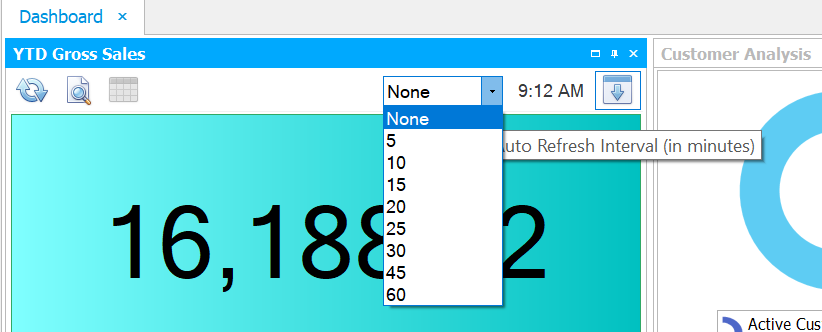
Note that using an auto-refresh interval that is too short may impact the performance of the system depending on the number of dashboard components, volume of data, and the complexity of the data transformation.
in the Dashboard Designer of the Design Studio, you can pre-define the auto-refresh interval when creating a new dashboard. See the Online Administrator Guide for more information about the Dashboard Designer.
- The dashboards can be arranged the way you like them.
- To move a dashboard, move the cursor to the title bar of the dashboard component.
Click and drag the window to the desired position. This will disconnect the dashboard from the tab and allow you to position it anywhere on your screen, or on another monitor.
You can also use the automatic pinning controls to position the dashboard component. Once you move the cursor to the title bar of the dashboard component and click and begin to drag the component, the automatic pinning controls appear. Simply drag the component to one of the automatic pinning controls and release the mouse button.
- To dock the dashboard in a position relative to another dashboard, move the cursor to the title bar of the dashboard component. Click and begin to drag the component, until the automatic pinning controls appear (seen in the image below).
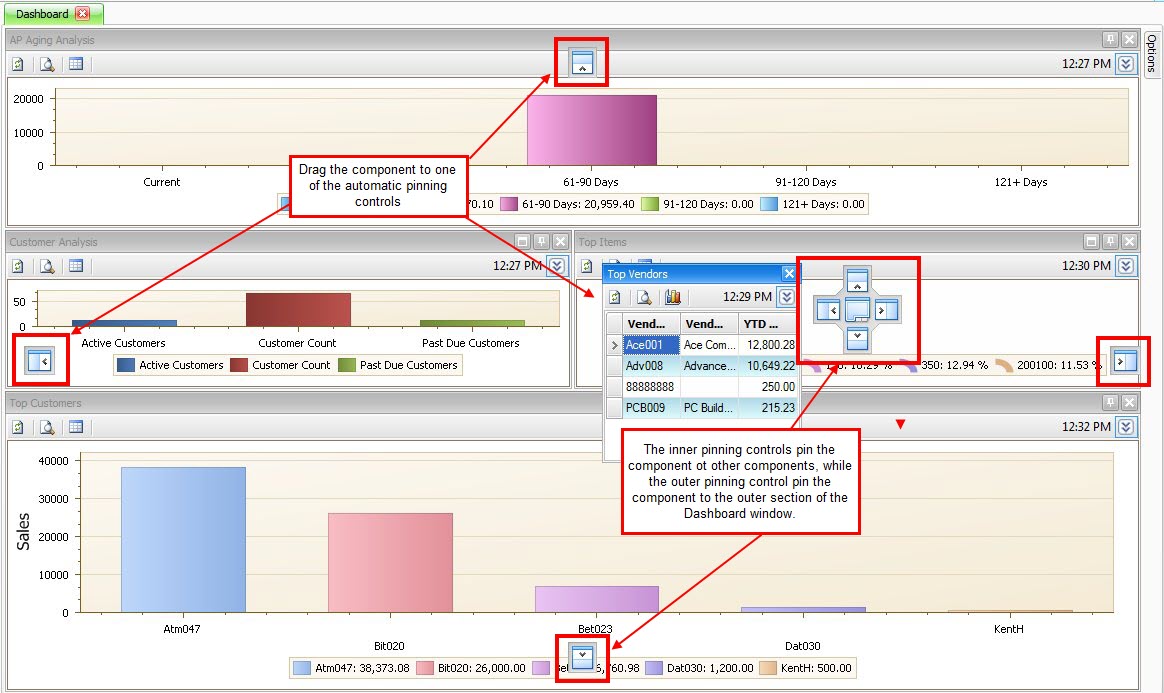
Drag the component to one of the automatic pinning control icons. The inner pinning controls pin the component to other components, while the outer pinning controls pin the component to the outer section of the Dashboard window.
Release the mouse button to drop the component onto the pinning control icon.
- Use the Expand/Collapse button (
 ) to expand or collapse the dashboard's parameters section.
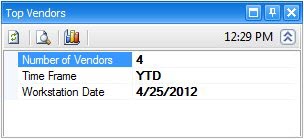
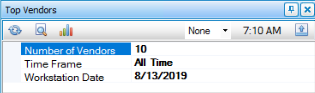
You can use the parameters section of the dashboard to adjust the parameters being used to display data. The parameters available will vary depending on the dashboard you are setting the parameters for.
) to expand or collapse the dashboard's parameters section.
You can use the parameters section of the dashboard to adjust the parameters being used to display data. The parameters available will vary depending on the dashboard you are setting the parameters for.
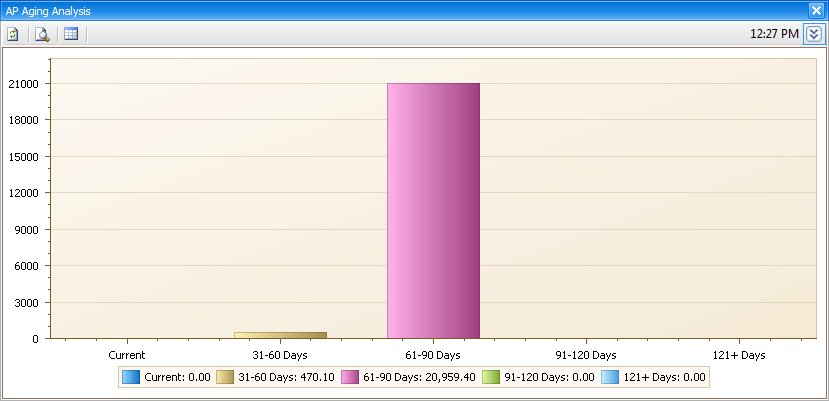
- Some dashboards have drill down capabilities to see details of the information displayed in the graph. The AR Aging Analysis is an example of a dashboard that has a drill down. To see the details, double-click on a graph element and the detail window will display.
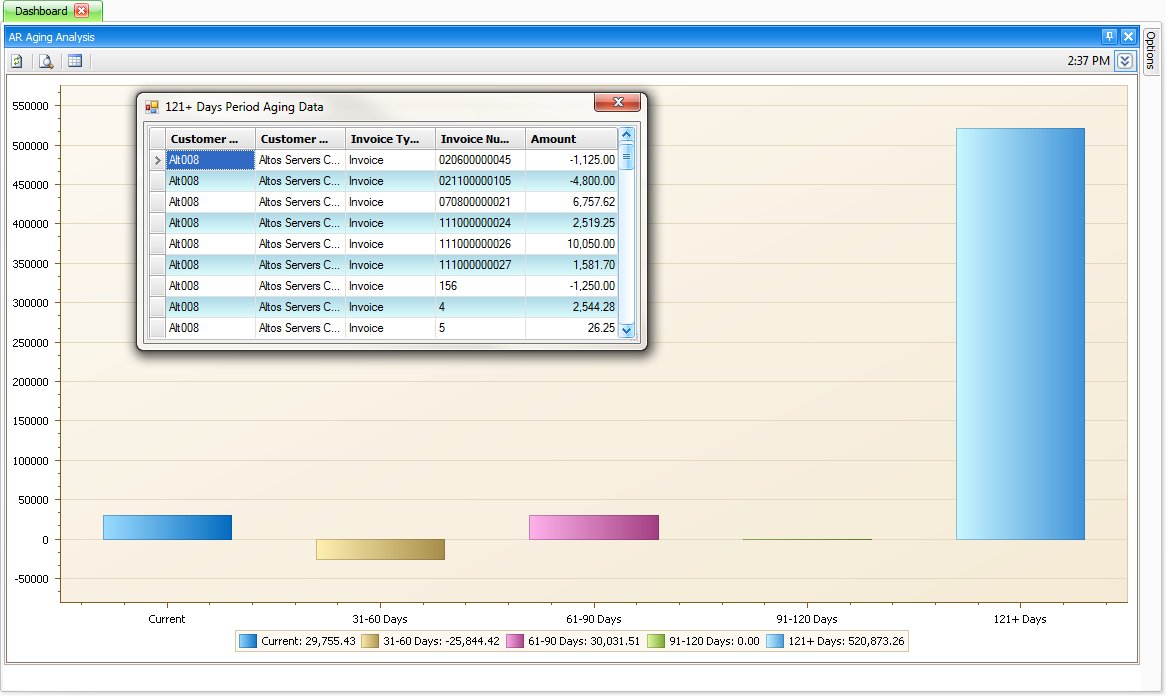
The drill down is only active when viewing the dashboard as a graph.
- To save your dashboard for the next time you open the dashboard function, configure the Dashboard to your liking. Click the Save Layout button in the Dashboard Options window to save the current layout. The next time you open the Dashboard you will see dashboards arranged the way they were when you saved the dashboard.
The tool bar for each dashboard can be used for several functions to control how the dashboard appears and other functionality.
| Button | Icon | Function |
|---|---|---|
| Refresh |
|
Refresh the dashboard. |
| Print Preview |

|
Preview the dashboard as a report, and allow you to save the dashboard as a .pdf file or an image file to insert into a document or slide presentation. |
| Graph |

|
Toggle a grid-viewed dashboard as a graph. |
| Grid |

|
Toggle a graph-viewed dashboard as a grid. |
| Time display | Shows the time of the last dashboard refresh. This is taken from the workstation and the time the Refresh button was last activated. | |
| Parameter Open/Expand |
|
Display parameters than can be edited. Also expands the toolbar for the dashboard component you are working with. |
| Parameter Close/Collapse |

|
Hides parameters that can be edited. Also collapses the toolbar for the dashboard component you are working with. |
| Pin |
|
Pin or unpin the dashboard to the screen in the current location. |
| Close |

|
Close the dashboard. |
The graph style and color can be edited for each graph by right-clicking anywhere within the graph area. When you right-click, a dialog box will allow you to select the graph style and color scheme for the graph.
Resizing Dashboard Components
- Move the cursor to the edge of the window to resize until the cursor changes to a double-sided arrow (seen in the example image below).

- Click and drag the window to the desired size.
- Release the mouse button.
- Move the cursor to the edge of the section to resize until the cursor change to a double-sided arrow (seen in the example image below).

- Click and drag the section to the desired size.
- Release the mouse button.